
Analytics & Dashboard
Last updated: 2026-04-12
The analytics dashboard gives you insight into how your business is performing on Rixa.
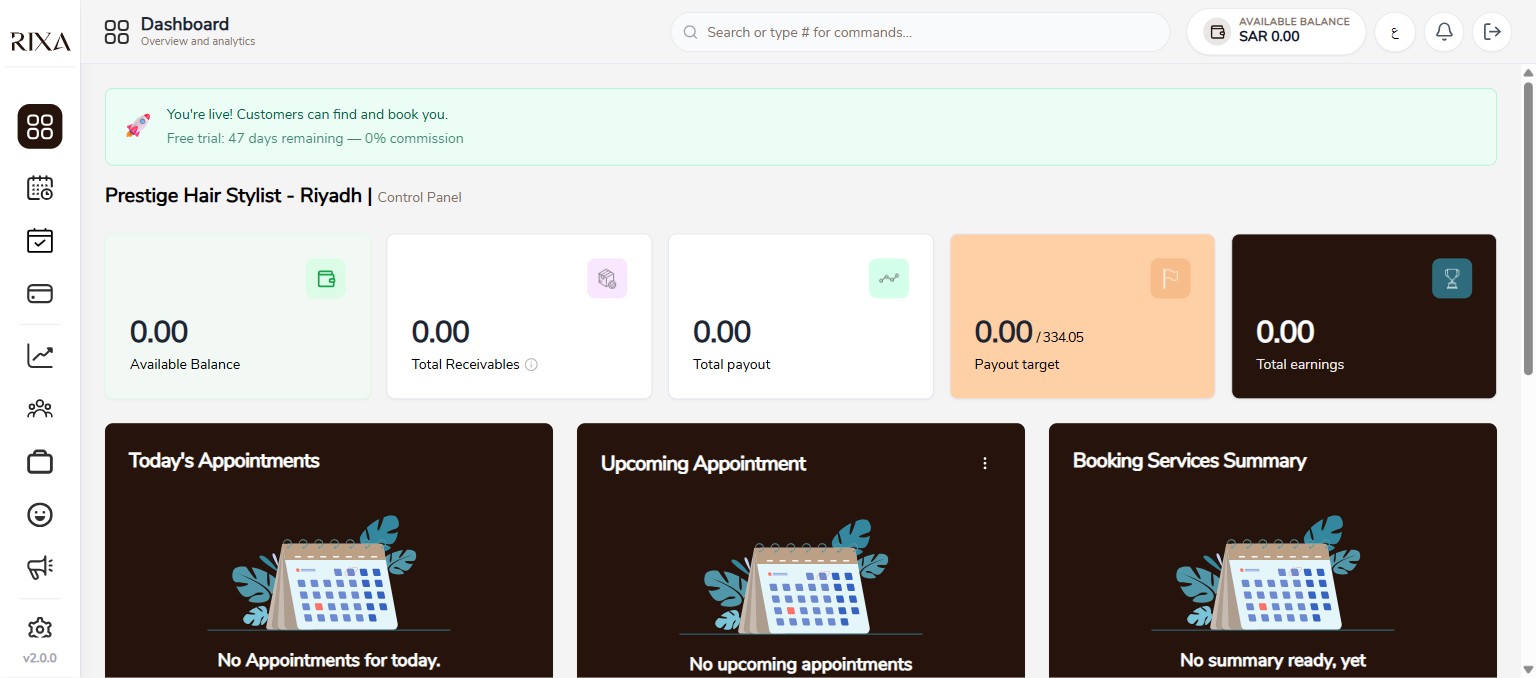
Dashboard Overview
Your dashboard shows key metrics at a glance including total revenue, booking count, average rating, and new customers. Data can be filtered by date range.
Revenue Metrics
Track your earnings over time. See daily, weekly, and monthly revenue trends. Identify your busiest periods and plan staffing accordingly.
Booking Metrics
View the total number of bookings, completion rate, cancellation rate, and no-show rate. High completion rates and low cancellation rates indicate a healthy business.
Ratings Overview
See your average rating trend over time and how recent reviews are affecting your overall score. A consistent or improving rating trend is a good sign.
Using Analytics to Grow
Use your data to make informed decisions. If certain services generate more revenue, consider promoting them. If a specific day is slow, create an offer to drive bookings. If your cancellation rate is high, review your scheduling and communication practices.